
Most solar figures you see are forecasts. These are bills. I run My Energy Expert and this is my own house in London: ten panels, one battery, and the electricity account for July to September 2026. The numbers come from my supplier's bills and the inverter's own counters. They are summer numbers from one home, so read them as an example of how the pieces fit together, and nothing more than that.
See what your own roof could do
Draw your roof on a map and get an indicative system size, cost and yearly saving in about two minutes. No contact details needed to see your numbers.
The system
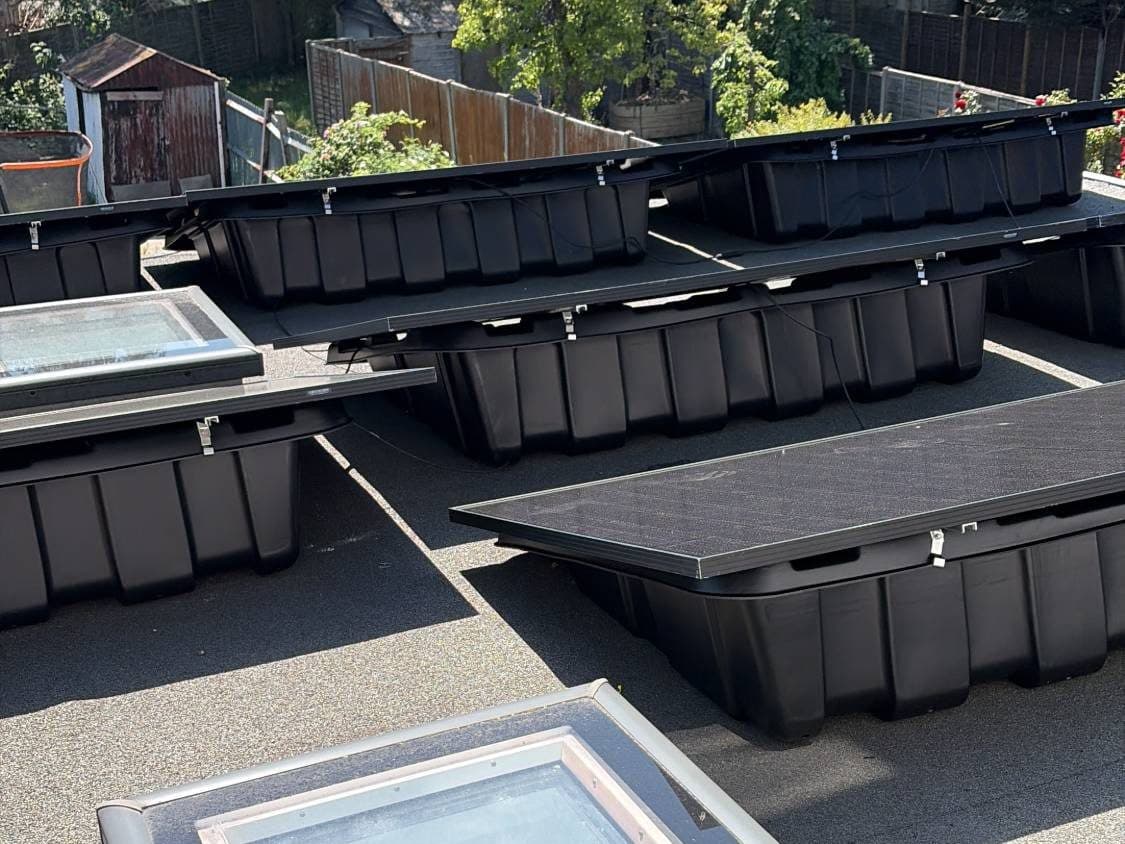
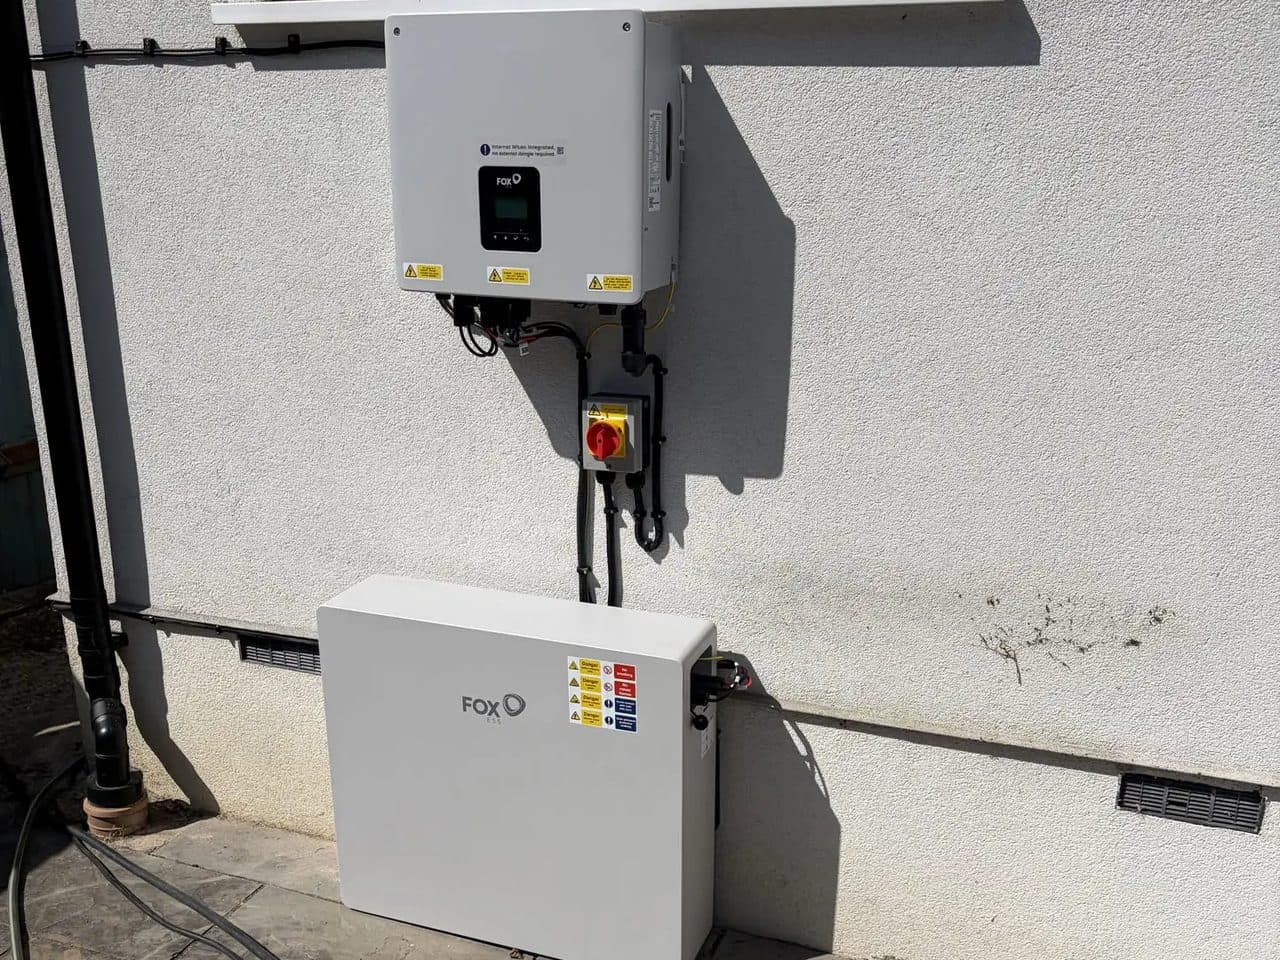
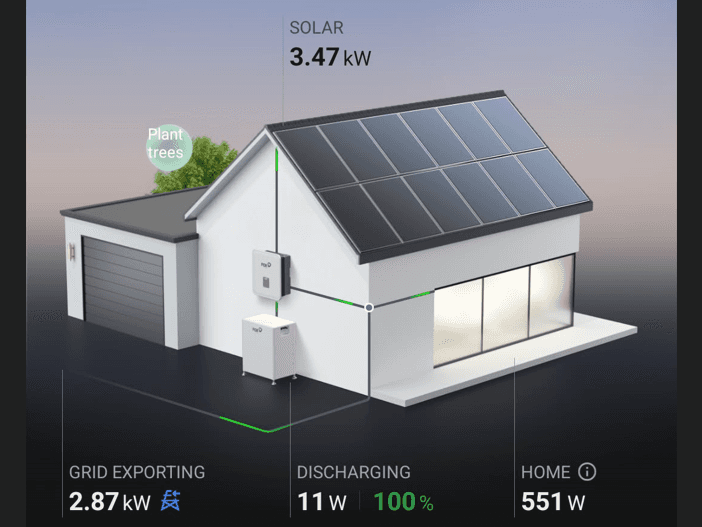
The array is ten 500 W panels, 5 kWp in total, mounted on a flat roof in frames that tilt them 18 degrees towards the south-south-east, with no shading. They feed a FoxESS 5 kW hybrid inverter and a FoxESS EP12 battery with 11.52 kWh of storage.
The house is a fairly heavy electricity user at around 15 to 17 kWh a day. For comparison, Ofgem's typical home uses about 2,500 kWh a year, which is closer to 7 kWh a day. A lighter user would see smaller numbers than mine in every section below.
The tariff matters as much as the kit. Import is Intelligent Octopus Go, which charges 7.62p per kWh between 11:30pm and 5:30am and 32.69p the rest of the day. It is a tariff for homes with an electric car or a compatible charger, so it is not open to everyone, although other overnight tariffs sit in a similar 7 to 9p range. Export is Agile Outgoing, where the price paid for each unit changes every half hour.
The July bill
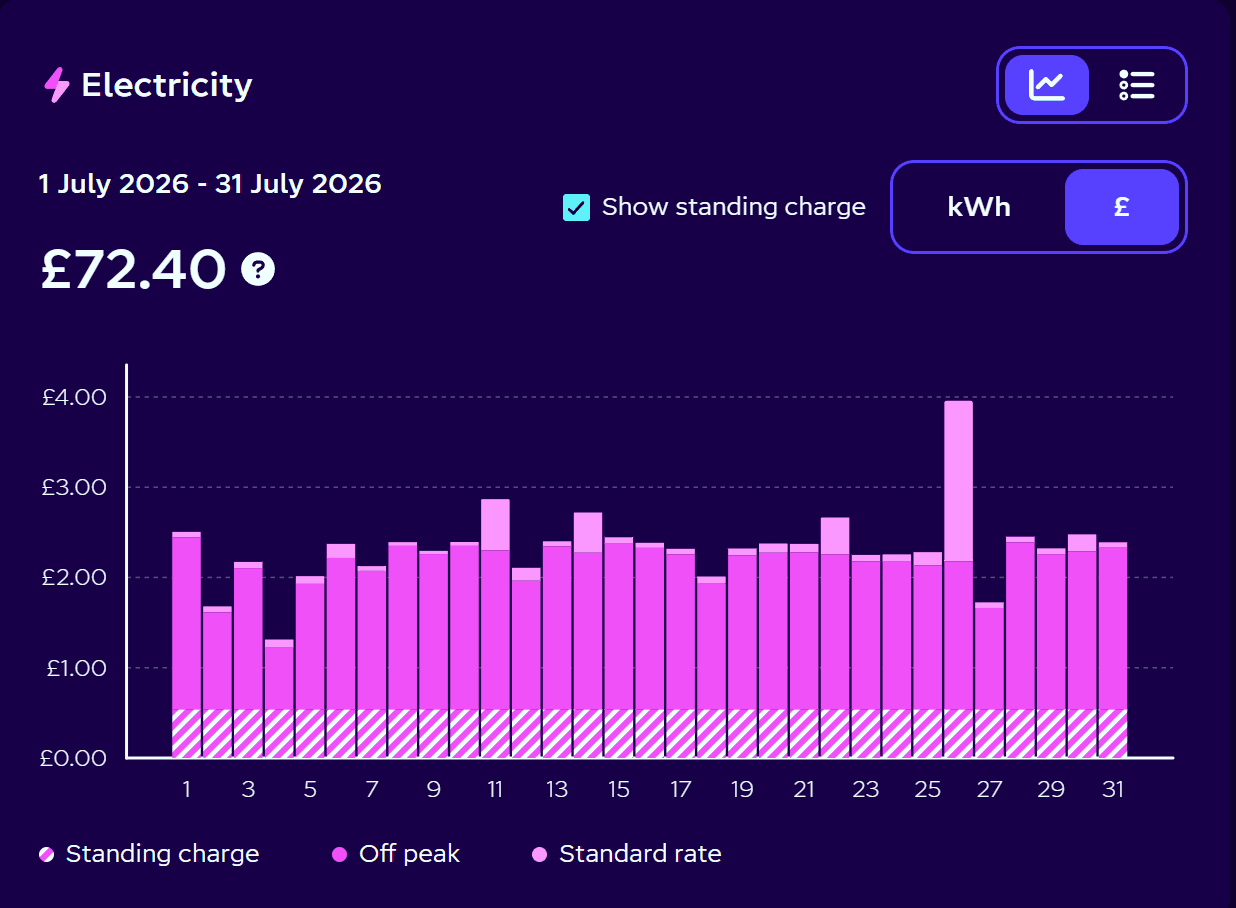
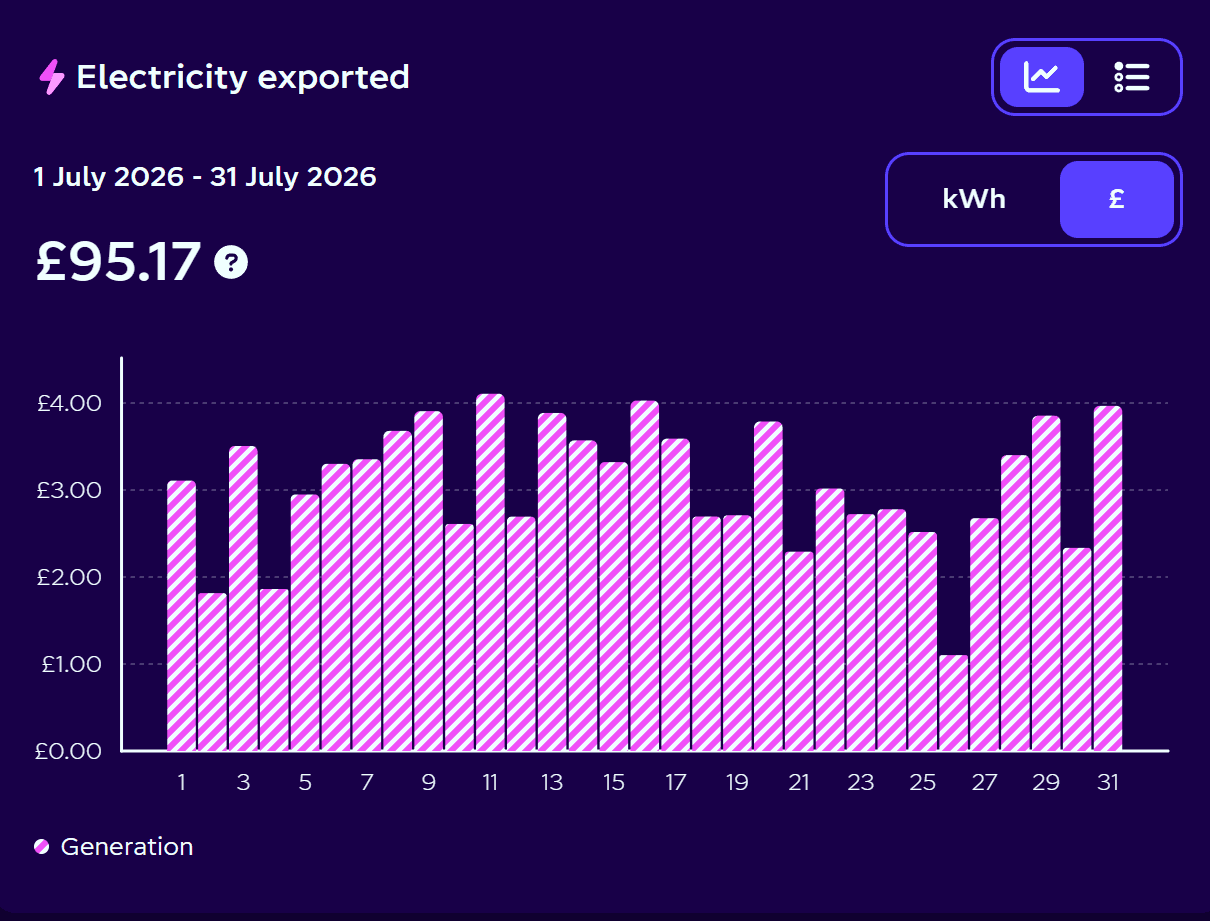
July is the cleanest month to look at because it is a full billing period. The house imported 640 kWh from the grid, which cost £72.06 including the standing charge. It exported 688 kWh and was paid £94.57 for it.
That leaves the electricity account £22.51 in credit for the month. Export income covered the whole import bill, standing charge included. Gas is billed separately and is not part of any figure on this page.
One detail explains most of it: 97.4% of the electricity I bought in July was bought at the 7.62p overnight rate. The battery fills up while the price is low, and the house then runs on solar and stored power through the expensive part of the day.
For scale, the same house using the same electricity on a standard tariff with no system would have paid about £175 for July.
Two months, 11 July to 11 September
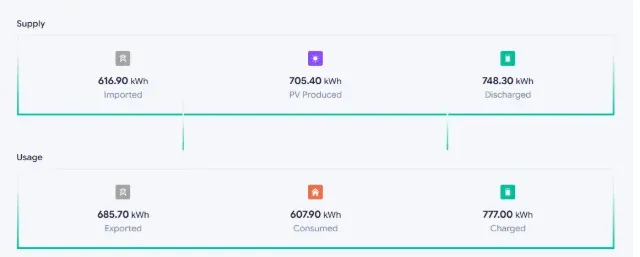
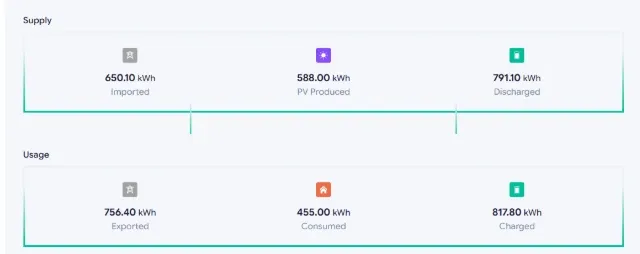
Over those two months the panels generated 1,161 kWh, about 19 kWh a day. The house used 859 kWh.
The grid figures look odd at first. I imported 1,115 kWh, which is more than the house used, at a cost of £145.56. I exported 1,305 kWh and was paid £206.35. Net, the electricity account finished £89.69 in credit, or roughly £1.49 a day.
Import is higher than usage on purpose. The battery buys electricity overnight at 7.62p and sells what the house does not need during the evening peak, where my export price averaged about 13.7p. That gap is small per unit, but the battery does it every day.
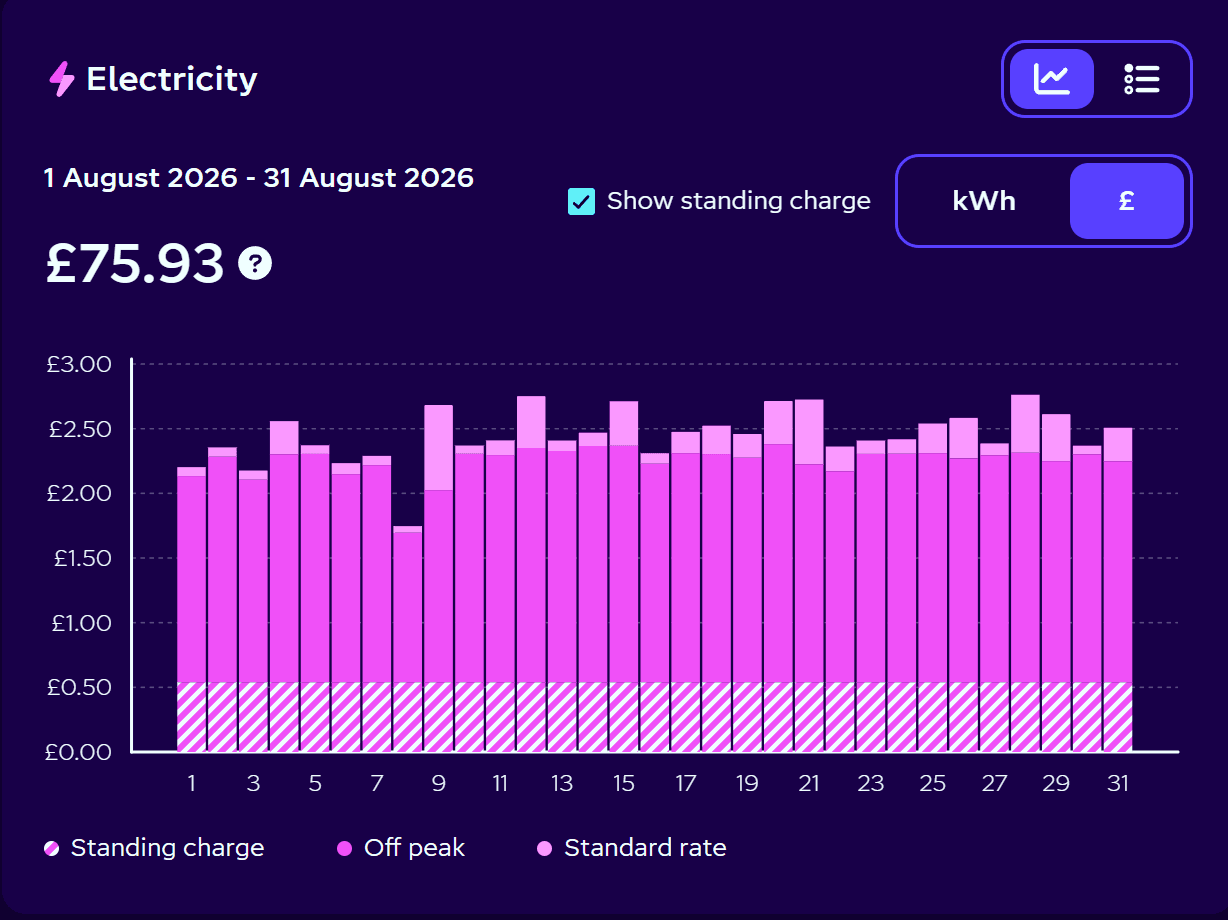
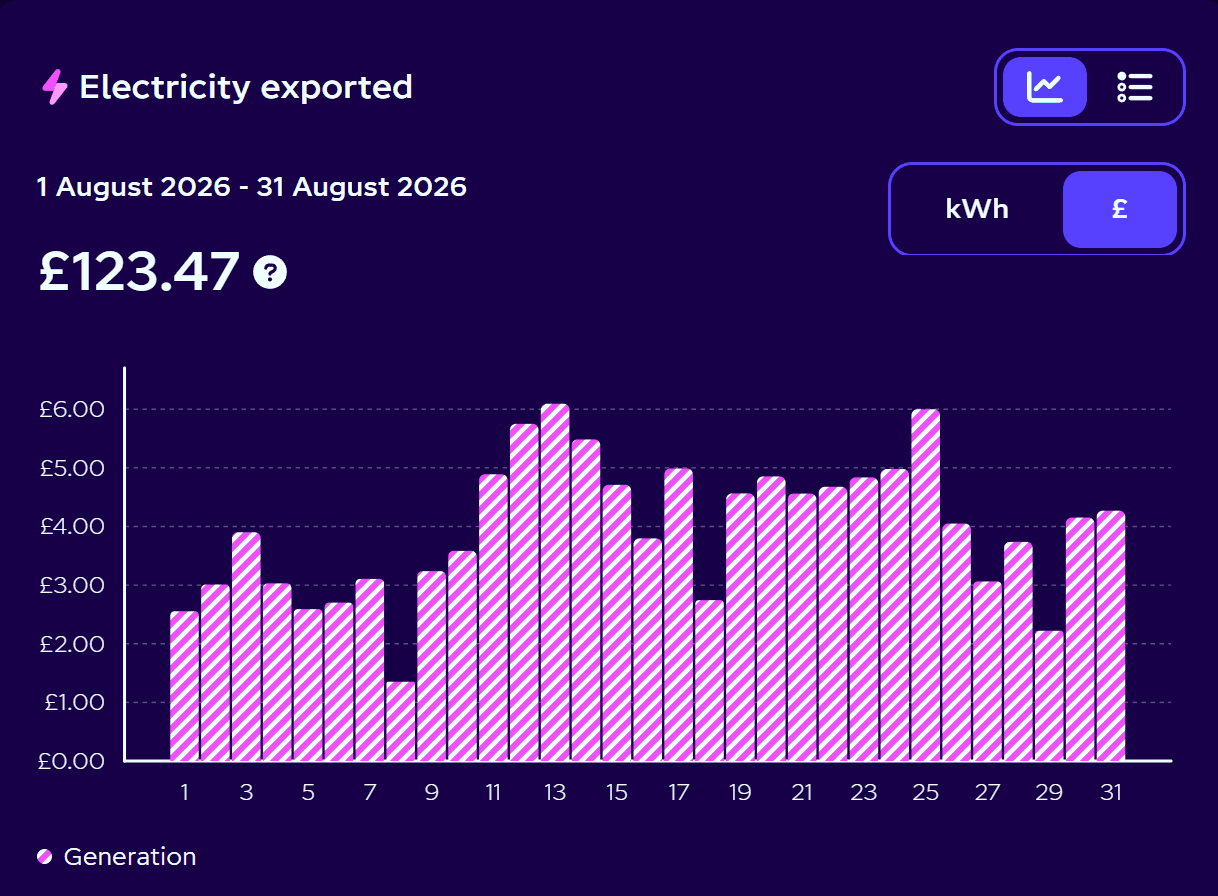
By calendar month the supplier's own charts show the same story. July finished £22.77 in credit. August was the strongest month: £75.93 bought, £123.47 sold, so £47.54 in credit.
Where the solar actually went
July's generation was about 690 kWh. Around 43% was used in the house as it was generated. Another 36% went into the battery: some of that ran the house in the evening, most was held back and exported at the evening peak when the price was best, and about 5% of the month's solar was lost in charging and discharging. The remaining 21% was exported straight away because the house and battery had no use for it at that moment.
So roughly half of the solar was used at home and a little under half was sold. On a basic export rate that sold half would be worth much less, which is why the next section matters.
How much of this is the tariff
A lot. Breaking July's benefit down by source, solar used directly in the house was worth about £91. Solar stored and used in the evening added about £17. Exported solar added about £42. Then there is a part that has nothing to do with the panels at all: electricity the battery bought overnight at 7.62p and either used or sold at peak was worth about £43.
The same panels and battery on a flat import tariff, with a low export rate and no overnight charging, would have produced a noticeably smaller saving. Anyone weighing up a system should weigh up the tariff in the same breath. Our guide to the best tariffs for a home battery covers the options, including the ones that do not need an electric car.
Smart tariffs also change. The rates above are what I paid in summer 2026 and neither tariff promises them for the future.
A small extra: grid events
Since August the battery has also been enrolled with Axle Energy, which pays £1 for every unit it exports during short grid events. By 20 September that had been eight events and £37. It is a modest top-up on the main result. I have written up every payment separately in the Axle review linked below, including the catches.
What these numbers do not tell you
They are summer numbers. July to September is when a solar system looks its best. In December the same panels will produce a fraction of this, the battery will be working mostly on overnight charging, and the electricity account will be a bill again. I will add winter figures to this page when I have them.
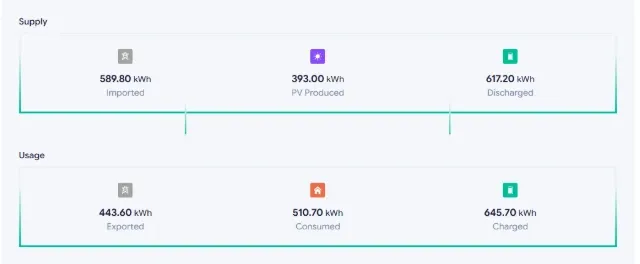
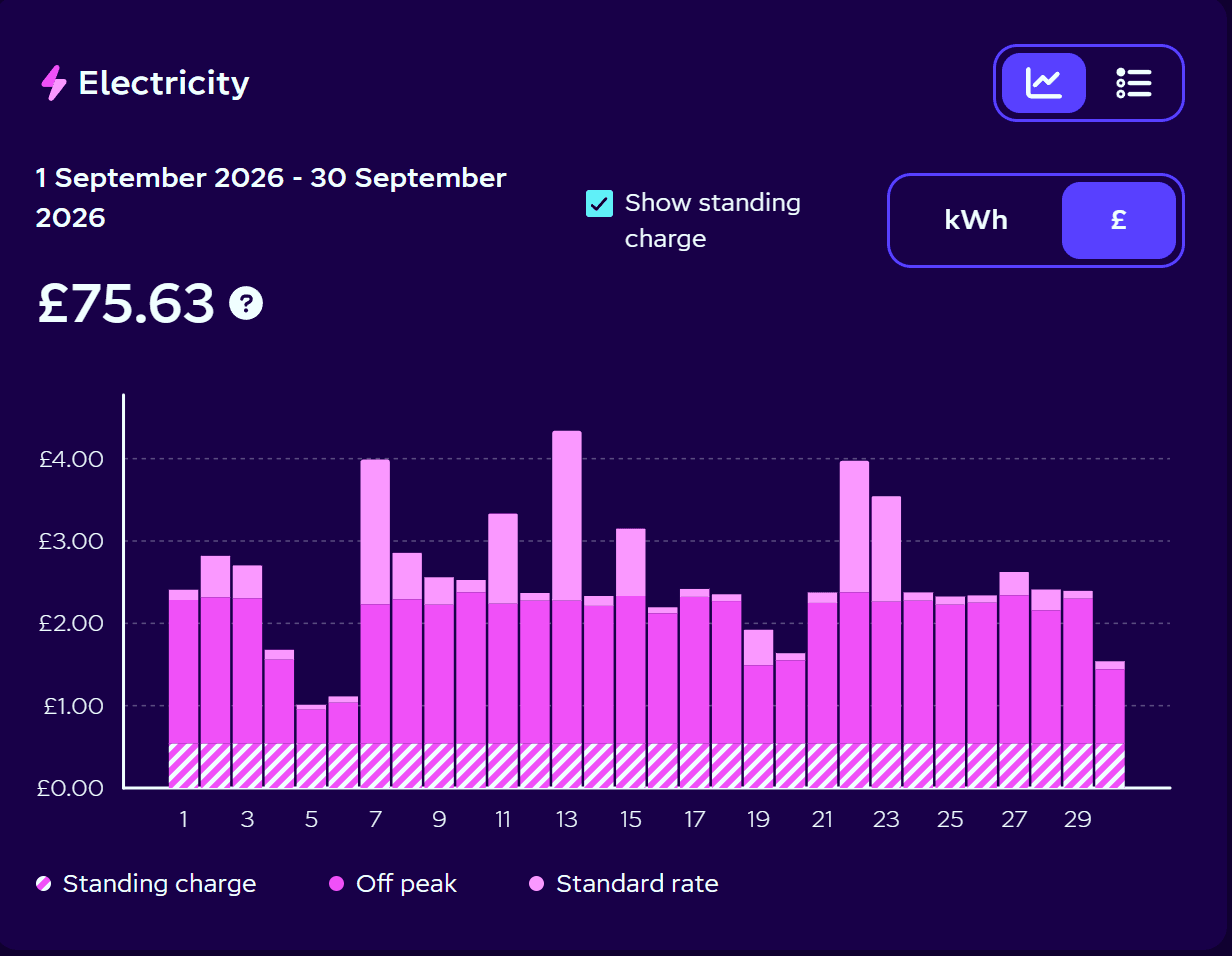
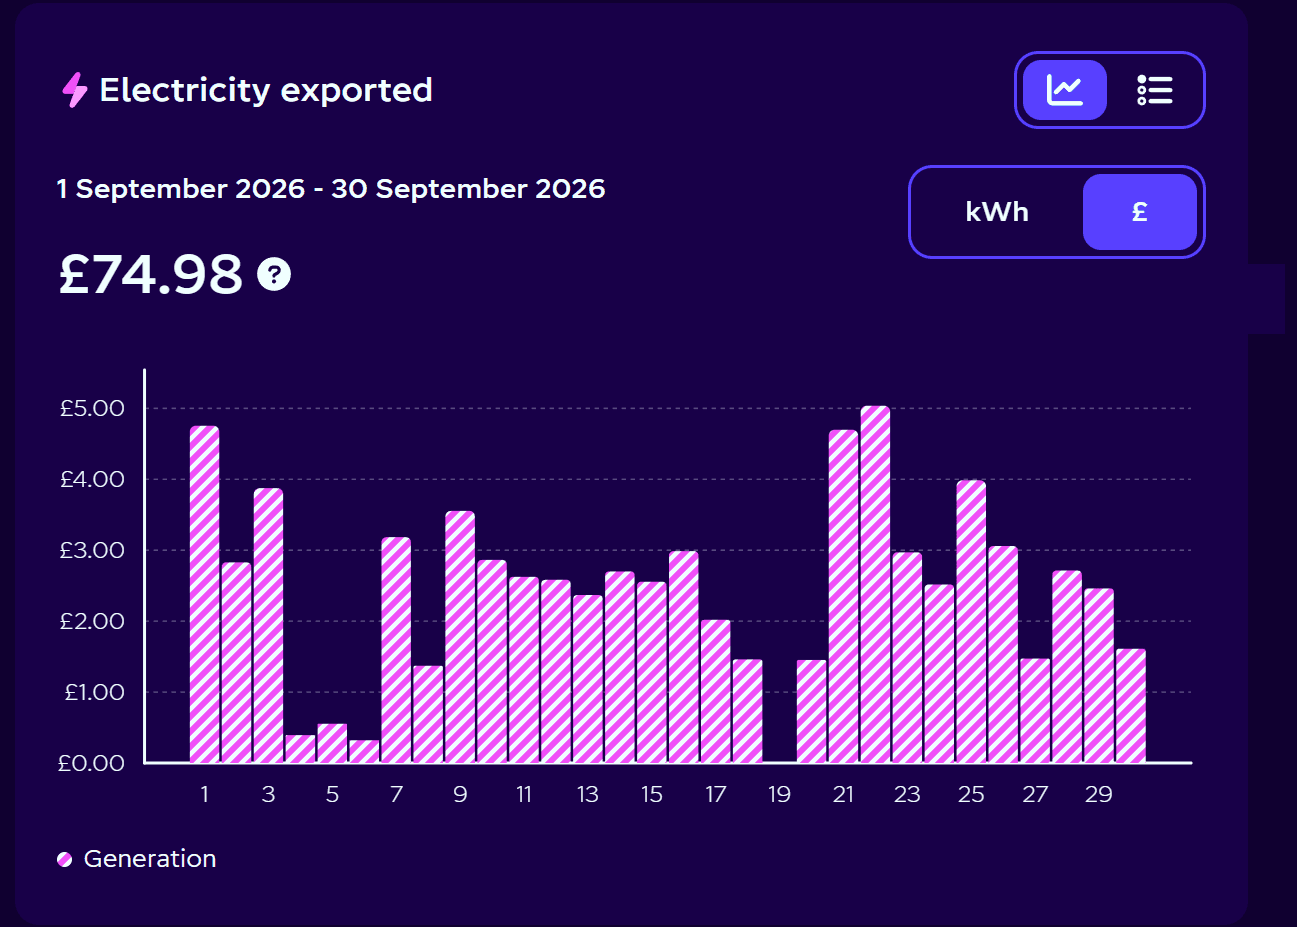
September already shows the turn. The panels produced 393 kWh against 705 kWh in July. Export income fell to £74.98 while import cost £75.63, so the month finished 65p in the red. Across the three calendar months the account is still £69.66 in credit, but the direction for autumn is clear.
They are one home's numbers. My roof, my usage and my tariff are not yours. A north-facing or shaded roof, a lighter electricity user, or a home that cannot get a cheap overnight rate will all see different results.
They say nothing about payback. Two months cannot tell you how long a system takes to earn back its cost, and I have deliberately not tried. Typical installed prices and the savings models we use are on our solar and battery page.
None of this is financial advice. It is here so you can see a real system's figures laid out plainly before you look at your own roof.
See what your own roof could do
Draw your roof on a map and get an indicative system size, cost and yearly saving in about two minutes. No contact details needed to see your numbers.